Multiple Choice
The normal distribution curve which models, distributions of data in a wide range of applications, is given by the function 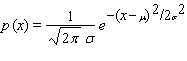 where
where  and
and  and
and  are constants called the standard deviation and the mean, respectively. Its graph is shown in the figure.
 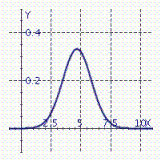 In a survey, consumers were asked to rate a new toothpaste on a scale of 1-10. The resulting data are modeled by a normal distribution with
  and
and  . The percentage of consumers who gave the toothpaste a score between a and b on the section is given by
  . Use a Riemann sum with n = 10 to estimate the percentage of customers who rated the toothpaste 4 or higher. (Use the range 3.5 to 10.5.)
A) 88%
B) 92%
C) 89%
D) 90%
E) 91%
Correct Answer:

Verified
Correct Answer:
Verified
Q16: Calculate the Riemann Sum for the integral
Q17: Evaluate the integral. <img src="https://d2lvgg3v3hfg70.cloudfront.net/TBX8650/.jpg" alt="Evaluate the
Q18: Calculate the left Riemann sums for the
Q19: Evaluate the integral. <img src="https://d2lvgg3v3hfg70.cloudfront.net/TBX8650/.jpg" alt="Evaluate the
Q20: Evaluate the integral. <img src="https://d2lvgg3v3hfg70.cloudfront.net/TBX8650/.jpg" alt="Evaluate the
Q22: A model rocket has upward velocity <img
Q23: The marginal cost function for the manufacture
Q24: Evaluate the integral. <img src="https://d2lvgg3v3hfg70.cloudfront.net/TBX8650/.jpg" alt="Evaluate the
Q25: Evaluate the integral. <img src="https://d2lvgg3v3hfg70.cloudfront.net/TBX8650/.jpg" alt="Evaluate the
Q26: Evaluate the integral. <img src="https://d2lvgg3v3hfg70.cloudfront.net/TBX8650/.jpg" alt="Evaluate the