Multiple Choice
Annual U.S. imports from China in the years 2001-2002 could be approximated by 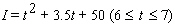 billion dollars per year, where
  represents time in years since the start of 1995. During the same period, annual U.S. exports to China could be approximated by
 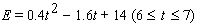 billion dollars per year. Compute the area between the graphs of
  and
and  over the interval
  .(Round your answer to the nearest $10 billion.)
A) $210 billion
B) $90 billion
C) $30 billion
D) $150 billion
E) $120 billion
Correct Answer:

Verified
Correct Answer:
Verified
Q58: The normal distribution curve, which models the
Q59: Calculate the 5-unit moving average of the
Q60: Find the area of the indicated region.
Q61: Find the total value of the given
Q62: Calculate the 5-unit moving average of the
Q64: If the integral converges, compute its value.
Q65: Find the area of the region enclosed
Q66: Find the general solution of the differential
Q67: For the differential equation, find the particular
Q68: You are saving for your retirement by