Multiple Choice
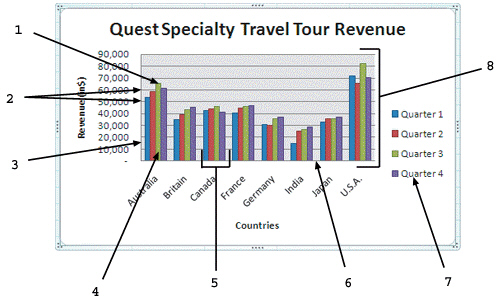 As shown in the figure above, item 5 represents ____.
A) a plot area
B) tick marks
C) a data series
D) a legend
Correct Answer:

Verified
Correct Answer:
Verified
Related Questions
Q19: You are having trouble keeping track of
Q20: <img src="https://d2lvgg3v3hfg70.cloudfront.net/TBX9074/.jpg" alt=" As shown in
Q22: A(n) _ identifies each data series in
Q25: <img src="https://d2lvgg3v3hfg70.cloudfront.net/TBX9074/.jpg" alt=" As shown in
Q65: Sub gridlines show the values between the
Q123: You can use buttons on the Insert
Q142: You can add a text box using
Q200: Which two charts compare trends over time
Q236: The z-axis of 3-D charts is used
Q420: To show how individual volume changes over