Multiple Choice
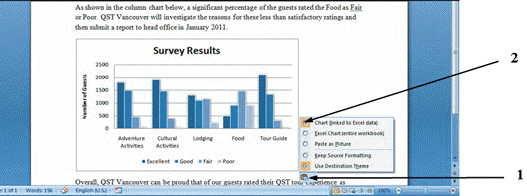 The chart shown in the figure above will reflect ____ updates made to the source chart in Excel.
A) color
B) font size
C) data
D) font type
Correct Answer:

Verified
Correct Answer:
Verified
Related Questions
Q4: Provide an example of why you might
Q16: Microsoft Office provides _ integration methods.<br>A) three<br>B)
Q34: <img src="https://d2lvgg3v3hfg70.cloudfront.net/TBX9074/.jpg" alt=" Because the pasted
Q35: The Paste Special command only allows one
Q37: <img src="https://d2lvgg3v3hfg70.cloudfront.net/TBX9074/.jpg" alt=" The icon pointed
Q40: Mary Lou Jacobs has requested that additional
Q41: Mary Lou Jacobs has requested that additional
Q42: Mary Lou Jacobs has requested that additional
Q43: Each time you change a linked value
Q157: You can copy _ and numbers between