Multiple Choice
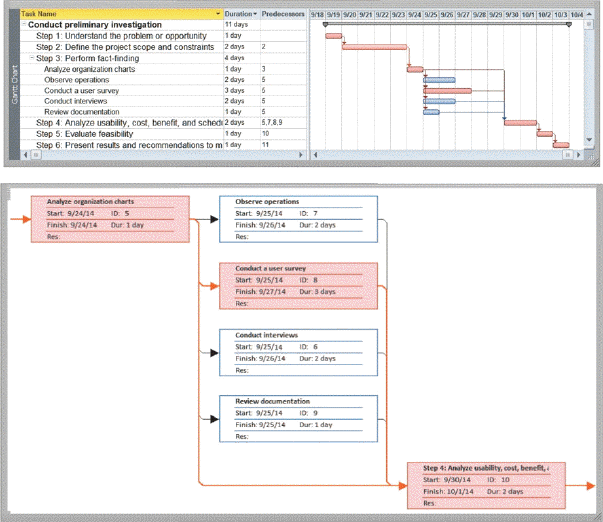
As shown in the accompanying figure, a Gantt chart, developed by Henry Gantt, is which of the following?
A) diagram that graphically shows how actors interact with an information system
B) tool that graphically shows the flow of data in a system
C) bar chart that uses horizontal bars to show project phases or activities
D) table that lists a variety of conditions and the actions that correspond to them
Correct Answer:

Verified
Correct Answer:
Verified
Q40: Interviewers, including systems analysts, ask three types
Q53: COGNITIVE ASSESSMENT Which of the following characteristics
Q61: The _ programming language, developed by Dennis
Q71: COGNITIVE ASSESSMENT What is an open source
Q92: In developing a computer security plan, the
Q108: An interpreter is a separate program that
Q111: During which of the following phases does
Q116: Critical Thinking Questions Case 12-2 In your
Q141: Many VARs (value-added resellers) provide complete systems.
Q143: COGNITIVE ASSESSMENT RAD is an acronym for