Multiple Choice
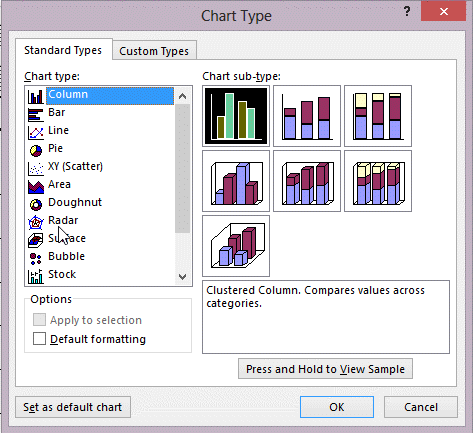 In the figure above, which chart would you most likely use to show cumulative totals in a stacked arrangement?
A) Scatter
B) Area
C) Bubble
D) Stock
Correct Answer:

Verified
Correct Answer:
Verified
Related Questions
Q7: <img src="https://d2lvgg3v3hfg70.cloudfront.net/TB8830/.jpg" alt=" -Three-dimensional charts are
Q22: Which chart type would best illustrate the
Q22: Identify four common chart types and what
Q28: You cannot always see actual chart values
Q33: All charts are modified in the _
Q45: A date formatted as 19-Apr-16 has a
Q56: Which of the following is NOT a
Q62: Which function would help you return a
Q65: Which chart type would be used to
Q74: A hashed border of a chart placeholder