Multiple Choice
The diagram below shows a light curve from a supernova. How many days after maximum light did it take for the supernova to decrease in brightness by a factor of 100?
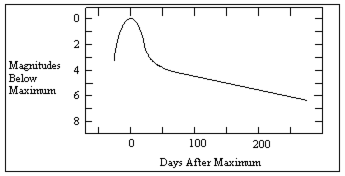
A) less than 50
B) 50
C) 150
D) 250
E) more than 250
Correct Answer:

Verified
Correct Answer:
Verified
Q25: Star clusters are important to our study
Q50: Which of the following nuclear fuels does
Q61: A white dwarf whose red giant companion
Q64: Explain the sequence of fusion shell formation
Q82: What properties of degenerate matter are important
Q96: A(n) _ is a collection of 10<sup>5</sup>
Q96: The helium core flash occurs in very
Q110: Synchrotron radiation is produced<br>A)in planetary nebulae.<br>B)by red
Q113: The triple-alpha process<br>A)controls the pulsations in Cepheid
Q126: In A.D. 1054, Chinese astronomers observed the