Multiple Choice
The graph in the following illustration shows the depths of a submarine at certain times. 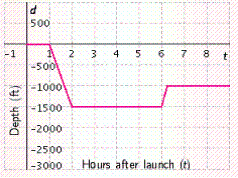
What is the sub doing as t increases from 1 to 2?
A) surfacing
B) diving
Correct Answer:

Verified
Correct Answer:
Verified
Related Questions
Q1: Determine whether the line that passes through
Q2: Find the domain and range of
Q4: If <span class="ql-formula" data-value="f (
Q5: Write an equation in slope-intercept form
Q6: Match each domain and range of
Q7: Consider the points <span class="ql-formula"
Q8: Use the slope-intercept form to write
Q9: Write the equation in <span
Q10: Give the coordinates of point E .
Q11: The graph of <span class="ql-formula"