Essay
The graph in the following illustration shows the depths of a submarine at certain times. 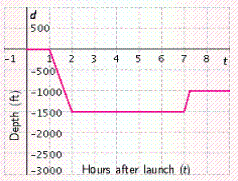 What is the sub doing as t increases from 1 to 2?
Correct Answer:

Verified
Correct Answer:
Verified
Related Questions
Q102: The graph in the following illustration shows
Q103: Which one of the following equations
Q104: Determine whether the graphs of the
Q105: Find the slope of the line
Q106: Refer to the graph. <img src="https://d2lvgg3v3hfg70.cloudfront.net/TBX8969/.jpg"
Q108: Graph the function by plotting the
Q109: Tiger Woods came back in the final
Q110: The _ of a line is the
Q111: Graph the function by plotting points.
Q112: _ is defined as the change in