Multiple Choice
The graph of a linear inequality is shown. Tell whether point (-2,-2) satisfies the inequality. 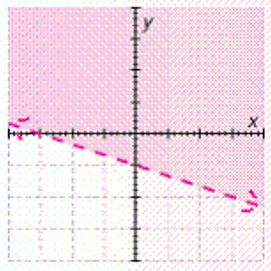
A) yes
B) no
Correct Answer:

Verified
Correct Answer:
Verified
Related Questions
Q45: The solution to the compound inequality
Q46: Solve: <br> <span class="ql-formula" data-value="| 7
Q47: Solve the compound inequality. Graph the
Q48: A music store has compact discs on
Q49: Graph the solution set of the
Q51: A student has scores of 70, 71,
Q52: Describe the graph of <span
Q53: Solve the equation. <span class="ql-formula"
Q54: Solve and graph the solution set:
Q55: Match each equation, inequality, or system