Multiple Choice
The graph of a linear inequality is shown. 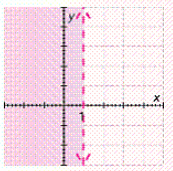
Give the inequality whose graph is shown.
A)
B)
C)
D)
E)
Correct Answer:

Verified
Correct Answer:
Verified
Related Questions
Q105: Match each equation, inequality, or system
Q106: Graph the inequality on a rectangular
Q107: An excavating company charges $330 an hour
Q108: Solve the inequality and graph the
Q109: Graph the inequality. <span class="ql-formula"
Q111: Solve the inequality: <span class="ql-formula"
Q112: Solve the inequality and graph the
Q113: Solve the compound inequality. Graph the
Q114: When two equations are joined by
Q115: Solve the inequality. Graph the solution