Multiple Choice
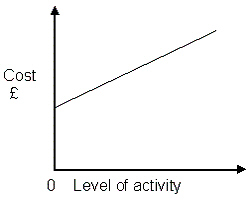 The graph above represents:
A) Variable costs
B) Semi variable costs
C) Stepped costs
D) Marginal costs
Correct Answer:

Verified
Correct Answer:
Verified
Related Questions
Q1: Which of the following descriptions describes contribution?<br>A)
Q2: AJ Ltd is an motor car insurance
Q3: Martin Green owns a hairdressing shop. He
Q4: In practice all costs can be divided
Q5: <img src="https://d2lvgg3v3hfg70.cloudfront.net/TBX8632/.jpg" alt=" The graph above
Q7: The independent variable is the cost to
Q8: Total variable cost will increase and decrease
Q9: A company manufactures and sells a single
Q10: It is assumed that in linear cost
Q11: Cost estimation relates to the ability for