Multiple Choice
Which of the following illustrations represents a circle graph?
A) 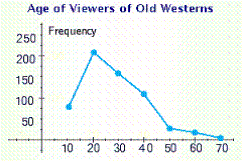
B) 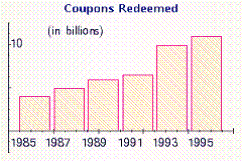
C) 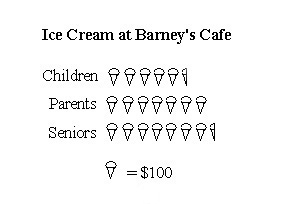
D) 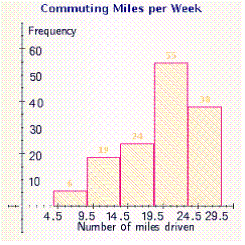
E) 
Correct Answer:

Verified
Correct Answer:
Verified
Related Questions
Q55: Refer to the pie graph that shows
Q56: Change the following percent to a
Q57: Write the sentence as a proportion
Q58: <span class="ql-formula" data-value="33 \frac { 1 }
Q59: 15% of the 980 students attending a
Q61: A shopper presents a coupon at a
Q62: To find 25% divide the number by 4 .<br>814.8<br>A) 203.7<br>B) 814.8<br>C)
Q63: By how much did the price of
Q64: What number is 60% of 350 ?<br>A) 220<br>B)
Q65: Estimate the percentage.<br>50% of 2,210<br>A) 1,100<br>B) 5,525<br>C)