Multiple Choice
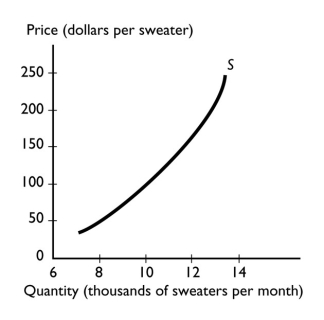
-The graph illustrates the supply of sweaters.As the technology used to produce sweaters improves,the
A) supply of sweaters decreases and the demand for sweaters does not change.
B) supply of sweaters increases and the demand for sweaters does not change.
C) quantity of sweaters supplied increases.
D) quantity of sweaters supplied decreases.
E) supply of sweaters increases and the demand for sweaters increases.
Correct Answer:

Verified
Correct Answer:
Verified
Q232: <img src="https://d2lvgg3v3hfg70.cloudfront.net/TB1458/.jpg" alt=" -The above figure
Q233: Demand curves slope _ because as the
Q234: A change in the demand for apples
Q235: A rise in the price of a
Q236: In the above figure,_ will shift in
Q238: The market demand curve for mangos is<br>A)
Q239: If consumers buy a large number of
Q240: <img src="https://d2lvgg3v3hfg70.cloudfront.net/TB1458/.jpg" alt=" -The above figure
Q241: <img src="https://d2lvgg3v3hfg70.cloudfront.net/TB1458/.jpg" alt=" -The table above
Q242: <img src="https://d2lvgg3v3hfg70.cloudfront.net/TB1458/.jpg" alt=" -Using the data