Multiple Choice
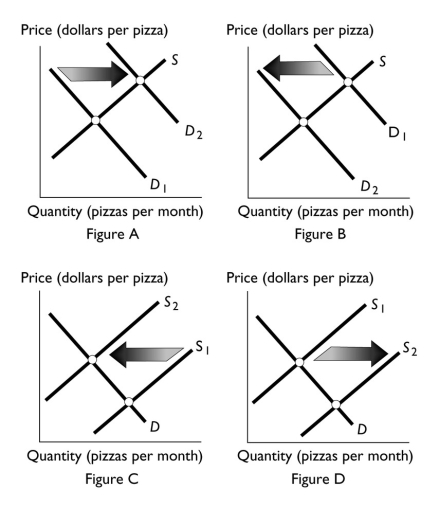
-Which figure above shows the effect of a decrease in the number of pizza sellers?
A) Figure A
B) Figure B
C) Figure C
D) Figure D
E) Both Figure B and Figure C
Correct Answer:

Verified
Correct Answer:
Verified
Related Questions
Q147: Suppose Ramen noodles,an inexpensive but a quite
Q148: If the price of carrots is below
Q149: Other things remaining the same,the quantity of
Q150: Which of the following lowers the equilibrium
Q151: <img src="https://d2lvgg3v3hfg70.cloudfront.net/TB1458/.jpg" alt=" -The above figure
Q153: Bagels and cream cheese are complementary goods.Suppose
Q154: Pizza and tacos are substitutes,and the price
Q155: Oil refiners can refine a barrel of
Q156: Consider the market for leather shoes.If producers
Q157: Smart phones are becoming less expensive as