Multiple Choice
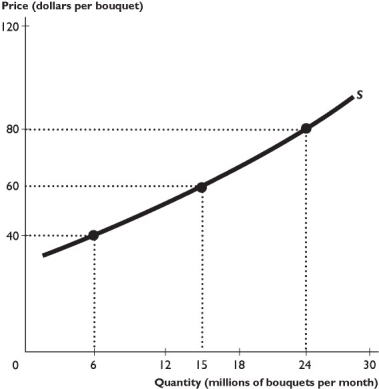
The figure above shows the supply curve for roses.
-In the figure above,at the point where the price is $60 per bunch,the price elasticity of supply is
A) 1.8.
B) 0.56.
C) 1.
D) 1.5.
E) 0.
Correct Answer:

Verified
Correct Answer:
Verified
Related Questions
Q49: The demand for a necessity generally is<br>A)
Q50: For a good such as food,the income
Q51: When income increases from $20,000 to $30,000
Q52: <img src="https://d2lvgg3v3hfg70.cloudfront.net/TB1458/.jpg" alt=" -A firm raises
Q53: The cross elasticity of demand for strawberry
Q55: <img src="https://d2lvgg3v3hfg70.cloudfront.net/TB1458/.jpg" alt=" -The demand curve
Q56: The demand for a good is more
Q57: For which of the following would the
Q58: Demand for a product tends to be
Q59: After long hair for men became popular,barbers