Multiple Choice
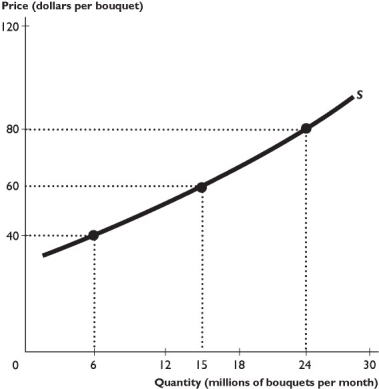
The figure above shows the supply curve for roses.
-Suppose an increase in supply lowers the price from $10 to $8 and increases the quantity demanded from 100 units to 130 units.Using the midpoint method,the elasticity of demand equals
A) 1.17.
B) 0.85.
C) 0.26.
D) 1.56.
E) None of the above answers is correct.
Correct Answer:

Verified
Correct Answer:
Verified
Q17: If wheat can be produced at a
Q18: When the price of Cosmopolitan magazine decreases
Q19: <img src="https://d2lvgg3v3hfg70.cloudfront.net/TB1458/.jpg" alt=" -Using the table
Q20: <img src="https://d2lvgg3v3hfg70.cloudfront.net/TB1458/.jpg" alt=" -The figure above
Q21: <img src="https://d2lvgg3v3hfg70.cloudfront.net/TB1458/.jpg" alt=" The figure
Q23: Is supply more elastic or less elastic
Q25: If a 1 percent increase in the
Q26: <img src="https://d2lvgg3v3hfg70.cloudfront.net/TB1458/.jpg" alt=" -The demand curve
Q27: Total revenue equals<br>A) price × quantity sold.<br>B)
Q202: "The price elasticity of demand is a