Multiple Choice
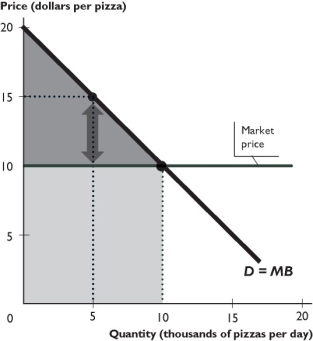
The figure above shows the demand curve for pizza and the market price of pizza.
-In the figure above,how much is the consumer who buys the 5,000th pizza willing to pay for that pizza?
A) $15
B) $10
C) $12
D) $22.50
E) $5
Correct Answer:

Verified
Correct Answer:
Verified
Related Questions
Q217: Marginal benefit is the benefit that a
Q218: What must be true for a producer
Q219: Samantha was willing to pay $10 for
Q220: Marginal benefit curves<br>A) have positive slopes.<br>B) have
Q221: <img src="https://d2lvgg3v3hfg70.cloudfront.net/TB1458/.jpg" alt=" -In the figure
Q223: If the price of a visit to
Q224: In a competitive market for a private
Q225: A demand curve can be interpreted as<br>A)
Q226: Seventy percent of Austin's chess club wanted
Q227: Often people trying to withdraw money from