Multiple Choice
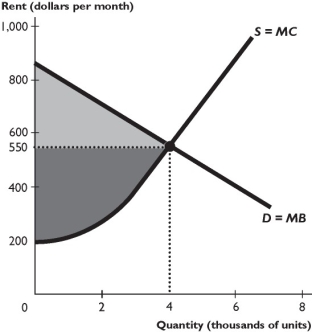
The figure above shows the supply and demand curves in the market for rental housing. A rent ceiling is set at $400 per month.
-As shown in the figure above,the rent ceiling
A) decreases consumer surplus.
B) increases producer surplus.
C) decreases deadweight loss.
D) increases the quantity of housing rented.
E) is efficient.
Correct Answer:

Verified
Correct Answer:
Verified
Q192: Which of the following decrease the deadweight
Q194: <img src="https://d2lvgg3v3hfg70.cloudfront.net/TB1458/.jpg" alt=" -The above figure
Q195: <img src="https://d2lvgg3v3hfg70.cloudfront.net/TB1458/.jpg" alt=" The figure
Q196: <img src="https://d2lvgg3v3hfg70.cloudfront.net/TB1458/.jpg" alt=" The figure
Q198: Suppose the current equilibrium wage rate for
Q199: <img src="https://d2lvgg3v3hfg70.cloudfront.net/TB1458/.jpg" alt=" -The above figure
Q200: A price floor<br>A) is the highest price
Q201: A rent ceiling set below the equilibrium
Q202: Suppose that the government imposes a price
Q288: Why do rent ceilings lead to shortages