Multiple Choice
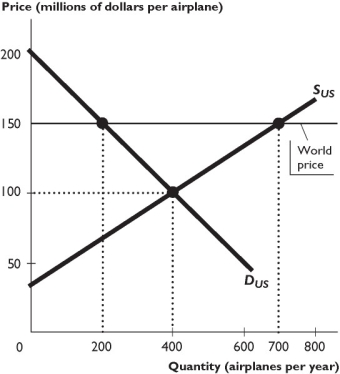
The figure above shows the U.S. market for airplanes, where SUS is the domestic supply curve and DUS is the domestic demand curve. The United States trades freely with the rest of the world. The world price of an airplane is $150 million.
-In the figure above,the United States ________ airplanes per year.
A) imports 500
B) exports 500
C) exports 400
D) imports 400
E) exports 200
Correct Answer:

Verified
Correct Answer:
Verified
Q165: Most t-shirts bought by Americans are made
Q166: <img src="https://d2lvgg3v3hfg70.cloudfront.net/TB1458/.jpg" alt=" The figure
Q167: Which of the following is true?<br>i.Compared to
Q168: <img src="https://d2lvgg3v3hfg70.cloudfront.net/TB1458/.jpg" alt=" -The figure above
Q169: How do imports affect buyers' consumer surplus?
Q171: Briefly define a tariff and a quota.Do
Q172: The _ are hurt by importing a
Q173: A nation will import a good if
Q174: A quota is a<br>A) quantitative restriction on
Q175: <img src="https://d2lvgg3v3hfg70.cloudfront.net/TB1458/.jpg" alt=" -The above figure