Multiple Choice
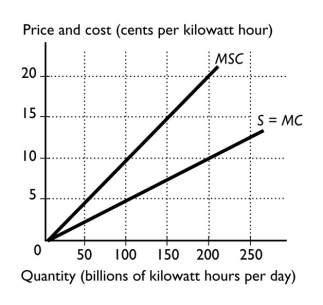
-The figure above shows the marginal social cost curve of generating electricity and the marginal private cost curve.The marginal cost borne by producers when 200 billion kilowatt hours are produced is
A) 0¢ per kilowatt.
B) 10¢ per kilowatt.
C) 20¢ per kilowatt.
D) 15¢ per kilowatt.
E) 5¢ per kilowatt.
Correct Answer:

Verified
Correct Answer:
Verified
Q67: Which of the following is an example
Q204: <img src="https://d2lvgg3v3hfg70.cloudfront.net/TB1458/.jpg" alt=" -The above figure
Q205: <img src="https://d2lvgg3v3hfg70.cloudfront.net/TB1458/.jpg" alt=" -The figure above
Q206: <img src="https://d2lvgg3v3hfg70.cloudfront.net/TB1458/.jpg" alt=" -The figure shows
Q207: An example of someone bearing the burden
Q210: <img src="https://d2lvgg3v3hfg70.cloudfront.net/TB1458/.jpg" alt=" -The figure above
Q211: Which of the following is an example
Q212: If the government taxes producers that create
Q214: Jacob pays $5,000 to paint his house
Q258: Which of the following best describes an