Multiple Choice
In the graph below, name the linear inequality in two variables that is represented by the shaded region. 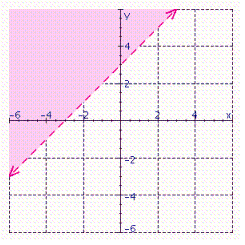
A) 
B) 
C) 
D) 
E) 
Correct Answer:

Verified
Correct Answer:
Verified
Related Questions
Q69: A square with sides 5 units long
Q70: Complete the given ordered pairs for the
Q71: Solve the system by solving one of
Q72: Solve the system using the substitution method.
Q73: Solve the system of linear equations by
Q75: Give the coordinates of the point in
Q76: Solve the system of linear equations by
Q77: Solve the system by solving one of
Q78: Solve the system using the substitution method.
Q79: Solve the system using the substitution method.