Multiple Choice
In the graph below, name the linear inequality in two variables that is represented by the shaded region. 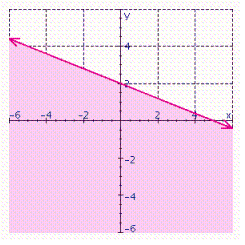
A) 
B) 
C) 
D) 
E) 
Correct Answer:

Verified
Correct Answer:
Verified
Related Questions
Q18: For the equation complete the ordered pair
Q19: Graph the solution set. <img src="https://d2lvgg3v3hfg70.cloudfront.net/TBX8808/.jpg" alt="Graph
Q20: Solve the system of linear equations by
Q21: Solve the system of linear equations by
Q22: Solve the system of linear equations by
Q24: Graph the line with the given slope
Q25: Complete the given ordered pairs for the
Q26: Cassandra buys a new color copier for
Q27: Solve the system of linear equations by
Q28: For the equation complete the ordered pairs.