Short Answer
In the graph below, name the linear inequality in two variables that is represented by the shaded region. 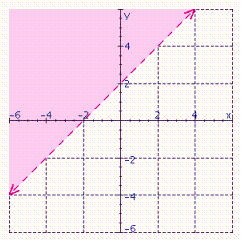
Correct Answer:

Verified
Correct Answer:
Verified
Related Questions
Q79: Solve the system using the substitution method.
Q80: Graph the solution set for the equation.
Q81: Find y if the line through (2,
Q82: For the equation complete the ordered pairs.
Q83: Solve the system of linear equations by
Q85: A square with sides 7 units long
Q86: Graph the inequality. <img src="https://d2lvgg3v3hfg70.cloudfront.net/TBX8808/.jpg" alt="Graph the
Q87: Solve the system by substitution. Substitute the
Q88: Find three solutions to the following equation,
Q89: Solve the system by eliminating the <img