Short Answer
In the graph below, name the linear inequality in two variables that is represented by the shaded region. 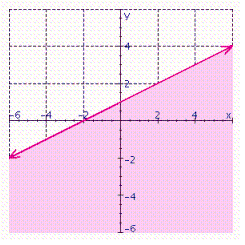
Correct Answer:

Verified
Correct Answer:
Verified
Related Questions
Q190: In the graph below, name the linear
Q191: Solve the system of linear equations by
Q192: Graph the line that has an x
Q193: Jane takes a job at the local
Q194: Solve the system using the substitution method.
Q196: Solve the system by substitution. Substitute the
Q197: Graph the vertical line x = 7.
Q198: Graph the inequality. <img src="https://d2lvgg3v3hfg70.cloudfront.net/TBX8808/.jpg" alt="Graph the
Q199: Solve the system of linear equations by
Q200: Graph the solution set. <img src="https://d2lvgg3v3hfg70.cloudfront.net/TBX8808/.jpg" alt="Graph