Multiple Choice
The following graph shows the relationship between a company s profits P and the number of items it sells x . ( P is in dollars.)  State the domain and the range of the function.
A) 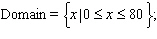
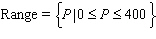
B) 

C) 

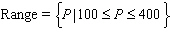
D) 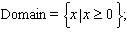

E) 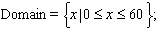
Correct Answer:

Verified
Correct Answer:
Verified
Related Questions
Q1: To produce this textbook, suppose the publisher
Q3: z varies jointly with x and the
Q4: The relative aperture or f -stop (
Q5: Find the slope of the line through
Q6: The temperature of a gas varies directly
Q7: Give the equation of the line perpendicular
Q8: Write the equation of the line with
Q9: A company manufactures and sells diskettes for
Q10: Graph the line that has an x
Q11: r is inversely proportional to s .