Multiple Choice
The following graph shows the relationship between a company s profits P and the number of items it sells x . ( P is in dollars.) What is their maximum profit? 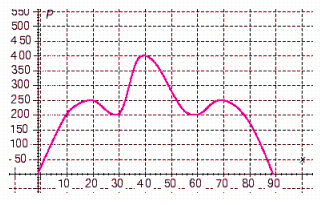
A) Their maximum profit is $250.
B) Their maximum profit is $200.
C) Their maximum profit is $325.
D) Their maximum profit is $800.
E) Their maximum profit is $400.
Correct Answer:

Verified
Correct Answer:
Verified
Q49: For the line x = - 2,
Q50: The slope of the line is m
Q51: Let <img src="https://d2lvgg3v3hfg70.cloudfront.net/TBX8808/.jpg" alt="Let and
Q52: Determine if the following table could represent
Q53: Let <img src="https://d2lvgg3v3hfg70.cloudfront.net/TBX8808/.jpg" alt="Let Evaluate
Q55: Write the equation of the line with
Q56: Let <img src="https://d2lvgg3v3hfg70.cloudfront.net/TBX8808/.jpg" alt="Let Evaluate
Q57: Find the slope of any line parallel
Q58: Let <img src="https://d2lvgg3v3hfg70.cloudfront.net/TBX8808/.jpg" alt="Let Evaluate
Q59: Let <img src="https://d2lvgg3v3hfg70.cloudfront.net/TBX8808/.jpg" alt="Let and