Short Answer
The following graph shows the relationship between a company s profits P and the number of items it sells x . ( P is in dollars.) How many items must the company sell to make their maximum profit? 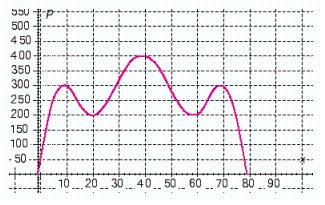 __________ items
Correct Answer:

Verified
Correct Answer:
Verified
Q70: Let <img src="https://d2lvgg3v3hfg70.cloudfront.net/TBX8808/.jpg" alt="Let and
Q71: Let <img src="https://d2lvgg3v3hfg70.cloudfront.net/TBX8808/.jpg" alt="Let Evaluate
Q72: Let <img src="https://d2lvgg3v3hfg70.cloudfront.net/TBX8808/.jpg" alt="Let Evaluate
Q73: Does the graph represent a function? <img
Q74: Line l is perpendicular to the graph
Q76: Let <img src="https://d2lvgg3v3hfg70.cloudfront.net/TBX8808/.jpg" alt="Let and
Q77: Write the equation of the line with
Q78: A musical tone's pitch varies inversely with
Q79: Let f ( x ) = 10
Q80: The slope of the line is <img