Multiple Choice
Which of the following illustrations represents a circle graph?
A) 
B) 
C) 
D) 
E) 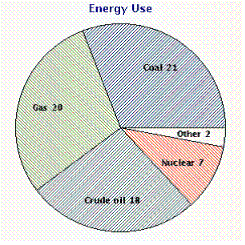
Correct Answer:

Verified
Correct Answer:
Verified
Related Questions
Q1: If a woman making $37,000 a year
Q5: Complete the following chart, which illustrates
Q8: <span class="ql-formula" data-value="33 \frac { 1 }
Q9: Change the following percent to a
Q11: Use the following pie graph to find
Q12: Write the sentence as a proportion
Q15: What number is 16% of 220?
Q19: After the first day of registration, 450
Q36: Change the following percent to a decimal.<br>180%<br>A)
Q46: A salesperson for a medical supplies company