Multiple Choice
Use the data in the table to make a line graph showing the average acreage (in acres) of U.S. farms for the years 1950 through 1990.
A) 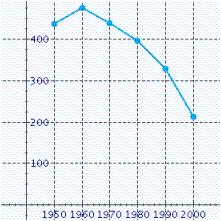
B) 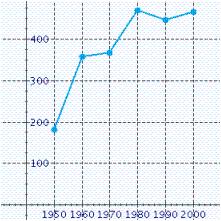
C) 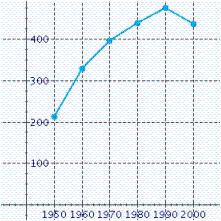
D) 
E) 
Correct Answer:

Verified
Correct Answer:
Verified
Related Questions
Q3: Find the mean of the list of
Q8: Refer to the pie graph that shows
Q9: Refer to the pictograph.<br>How much more money
Q11: Find the semester grade point average
Q11: Roberto received the same score on each
Q13: The magnitudes of the major earthquakes
Q21: What is the event " getting at least one tails "
Q23: Find the median of the list of
Q24: The scores on the first exam of
Q63: Which of the following is the sample