Multiple Choice
The illustration below lists the winning batting average for the years 1993 through 2000 in the major leagues. Draw a line graph for these data.
A) 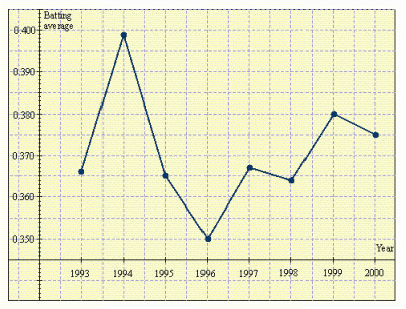
B) 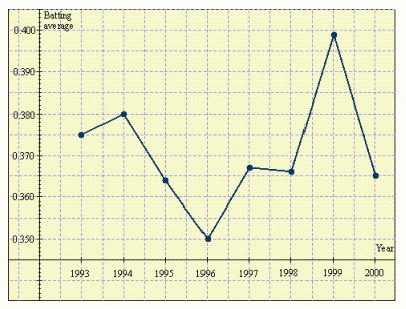
C) 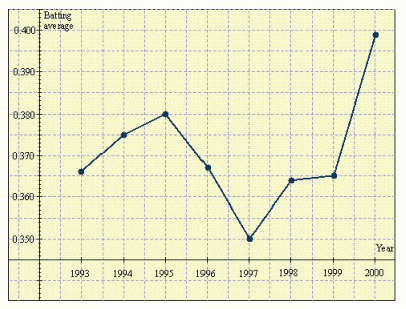
D) 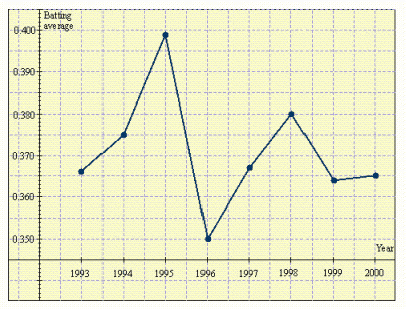
E) 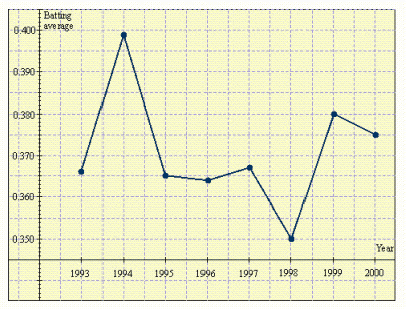
Correct Answer:

Verified
Correct Answer:
Verified
Related Questions
Q59: The Precision Manufacturing produces 20,000 machine nuts
Q60: Of 686 students, 362 are taking mathematics.
Q61: A poultry-eviscerating line processed the following
Q62: The sample space is the set
Q63: Use the figure below to answer the
Q65: Consider the following bar graph. How many
Q66: A trucking company had hauls of the
Q67: The sample space is the set
Q68: During a manufacturing process, 87 defective
Q69: A bag contains 1 red marble,