Multiple Choice
A sporting goods manufacturer makes baseballs. The target mass of a baseball is 145.5 grams with a standard deviation of ±3.5 grams. A technician selects 100 baseballs at random per hour and records the mean mass of the samples. The table below lists the mass in grams for a 36 hour period.
Determine the most accurate mean control chart drawn from the data shown in the table.
A) 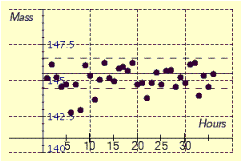
B) 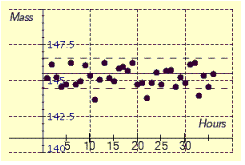
C) 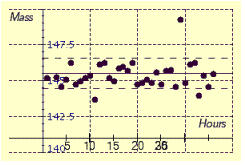
D) 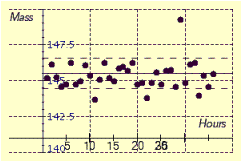
Correct Answer:

Verified
Correct Answer:
Verified
Q92: Find the mean measurement for the set
Q93: Find the mean measurement for the set
Q94: The following list gives 50 pieces
Q95: Find the sample standard deviation from
Q96: Two dice are rolled. What is
Q98: Find 48.7% of 360<sup>o</sup> Round your answer
Q99: Find the median measurement for the
Q100: Consider the following bar graph. How many
Q101: The following list gives 50 pieces
Q102: A card is chosen from a