Multiple Choice
The illumination of a light bulb is targeted at 1,170 lumens. The standard deviation is ±16.6 A technician randomly selects 15 bulbs per hour and records the mean illumination each hour. Determine the most accurate mean control chart drawn from the data shown in the table.
Hour
Illumination
1
1,145
2
1,156
3
1,141
4
1,183
5
1,180
6
1,180
Hour
Illumination
7
1,177
8
1,191
9
1,193
10
1,188
11
1,172
12
1,171
Hour
Illumination
13
1,179
14
1,161
15
1,159
16
1,173
17
1,190
18
1,143
Hour
Illumination
19
1,181
20
1,187
21
1,191
22
1,144
23
1,158
24
1,181
Hour
Illumination
25
1,192
26
1,191
27
1,165
28
1,181
29
1,168
30
1,195
A) 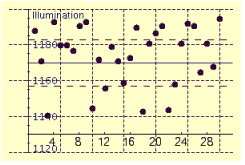
B) 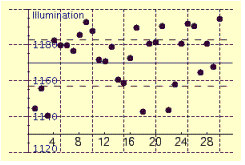
C) 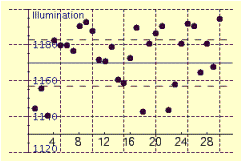
D) 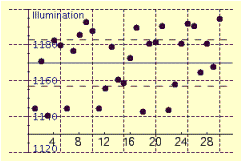
Correct Answer:

Verified
Correct Answer:
Verified
Q130: Find the median measurement for the
Q131: The sample space is the set
Q132: <span class="ql-formula" data-value="\begin{array}{|lc|}\hline \text { Shipment time
Q133: A department spends $16,349 of its $181,500
Q134: Find the mean measurement for the set
Q136: Candidate A was one of four candidate
Q137: Over an eight day period of time
Q138: The sample space of the cards with
Q139: The mileage on six vehicles leased for
Q140: Find the median measurement for the