Multiple Choice
What graph illustrates the inequality ?
A) 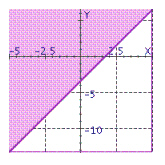
B) 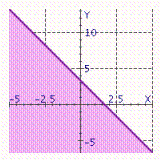
C) 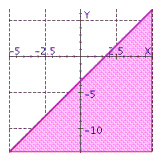
D) 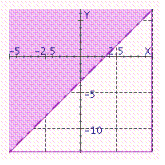
E) 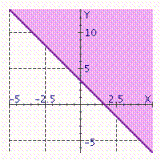
Correct Answer:

Verified
Correct Answer:
Verified
Related Questions
Q58: Doris invested some money at 7% and
Q59: Match the equations with their graphs.<br>-<img
Q60: Match the equations with their graphs.<br>-<img
Q61: Determine the y -intercept of the line
Q62: Find the slope of the line
Q64: Solve the system by using the
Q65: Find y if the line through
Q66: Graph the linear equation. <span
Q67: If an equivalent system for an
Q68: Solve the system by using the