Multiple Choice
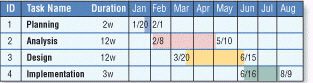 Figure 12-4 As shown in Figure 12-4, a Gantt chart, developed by Henry Gantt, is a ____.
A) diagram that graphically shows how actors interact with an information system
B) tool that graphically shows the flow of data in a system
C) bar chart that uses horizontal bars to show project phases or activities
D) table that lists a variety of conditions and the actions that correspond to them
Correct Answer:

Verified
Correct Answer:
Verified
Q138: <img src="https://d2lvgg3v3hfg70.cloudfront.net/TBX8777/.jpg" alt=" Figure 12-4 In
Q139: Integrated case products, sometimes called I-CASE or
Q140: The purpose of the _ phase is
Q141: When reviewing project requests, projects that receive
Q142: Horizontal market software typically is more expensive
Q144: For each system development project, a company
Q145: Unlike ERDs, systems analysts seldom use DFDs
Q146: The request for system services triggers the
Q147: A(n) _ is a formal review of
Q148: When the systems analyst identifies the data