Multiple Choice
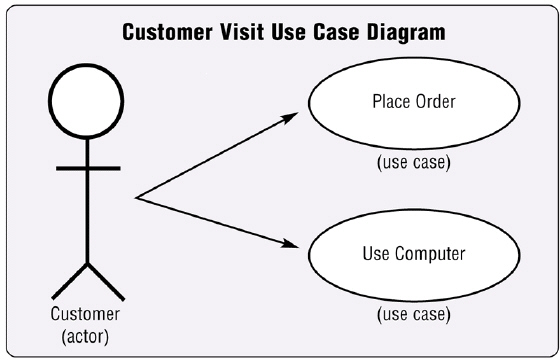 Figure 12-3 As shown in Figure 12-3, a(n) ____ diagram graphically shows how actors interact with an information system.
A) actor
B) software
C) use case
D) EMR
Correct Answer:

Verified
Correct Answer:
Verified
Related Questions
Q1: System development cycles often group many activities
Q2: <img src="https://d2lvgg3v3hfg70.cloudfront.net/TBX8777/.jpg" alt=" Figure 12-3 In
Q3: Project leaders can use _ such as
Q5: On a data flow diagram, a _
Q6: An important responsibility of a CSO is
Q7: The advantage of custom software is that
Q8: The system development cycle should group activities
Q9: The _ is a set of activities
Q10: <img src="https://d2lvgg3v3hfg70.cloudfront.net/TBX8777/.jpg" alt=" Figure 12-1 In
Q11: Technical feasibility addresses funding.