Multiple Choice
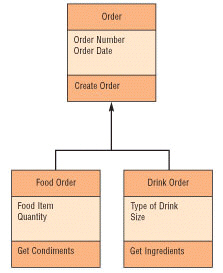 Figure 12-1 A(n) ____, such as that shown in Figure 12-1, graphically shows classes and subclasses in a system.
A) data flow diagram
B) use case diagram
C) class diagram
D) entity-relationship diagram
Correct Answer:

Verified
Correct Answer:
Verified
Related Questions
Q148: When the systems analyst identifies the data
Q149: On a data flow diagram, an arrow
Q150: A _ is a less formal method
Q151: A(n) _ publication is a magazine written
Q152: Although used in all types of business
Q154: The _ follows these six steps:<br>(1) analyze
Q155: A user may request a new or
Q156: The project dictionary helps everyone keep track
Q157: The _ phase consists of two major
Q158: _ occurs when one activity in a