Multiple Choice
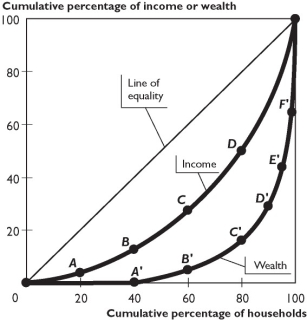
The figure above shows Lorenz curves for a nation.
-Based on the figure above,if the poorest 20 percent group of households increased the share of the nation's income they receive,then
A) there is a movement up along the Lorenz curve for income.
B) there is a movement down along the Lorenz curve for income.
C) the Lorenz curve for income shifts toward the line of equality.
D) the Lorenz curve for income shifts away from the line of equality.
E) Both answers A and C are correct.
Correct Answer:

Verified
Correct Answer:
Verified
Q12: Poverty for a household is defined as
Q13: <img src="https://d2lvgg3v3hfg70.cloudfront.net/TB1458/.jpg" alt=" The figure
Q14: A _ has a constant tax rate
Q15: <img src="https://d2lvgg3v3hfg70.cloudfront.net/TB1458/.jpg" alt=" The figure
Q16: Which of the following is a way
Q18: Fully explain why it is a good
Q19: The inequality of annual income<br>A) overstates the
Q20: Of the following types of income tax
Q21: The demand curve for high-skilled workers lies
Q22: The demand for labor<br>i.depends on the availability