Multiple Choice
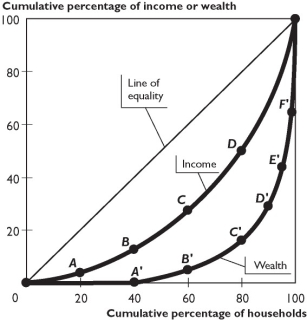
The figure above shows Lorenz curves for a nation.
-Based on the figure above,which of the following can cause a movement from point C to point D on the Lorenz curve for income?
A) an increase in income for the bottom 60 percent of households
B) an increase in income for the bottom 80 percent of households
C) a decrease in income for the bottom 60 percent of households
D) a decrease in income for the bottom 80 percent of households
E) None of the above answers is correct.
Correct Answer:

Verified
Correct Answer:
Verified
Q25: The higher the cost of acquiring skills,
Q38: "If the distribution of income was equal,
Q149: With a negative income tax that has
Q150: The demand curve for high-skilled workers<br>A) lies
Q152: A negative income tax is a system
Q155: How does an increase in the cost
Q158: What economic effect works to eliminate sex
Q159: As a tool that is used to
Q259: Describe the effect education and training have
Q351: What is "human capital"? How is it