Multiple Choice
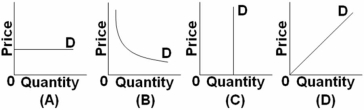 Refer to the above graphs.A price increase from $20 to $40 causes quantity demanded to decrease from 100 units to 50 units.Which graph best illustrates the price elasticity of demand for this good?
A) Graph A
B) Graph B
C) Graph C
D) Graph D
Correct Answer:

Verified
Correct Answer:
Verified
Q33: Based on the information in the table,which
Q34: Which product is most likely to be
Q35: As price increases along a downsloping linear
Q36: When the demand for a good is
Q38: <img src="https://d2lvgg3v3hfg70.cloudfront.net/TB4893/.jpg" alt=" Refer to the
Q39: A firm produces and sells two goods,A
Q40: What is the most likely effect of
Q41: At a price of $4 per unit,Gadgets
Q42: <img src="https://d2lvgg3v3hfg70.cloudfront.net/TB4893/.jpg" alt=" Refer to the
Q351: The price of gold is often volatile