Multiple Choice
The following table and line graph give the annual production of garbage in a country for some specific years. Find the slope of each of the four line segments, A , B , C , and D . 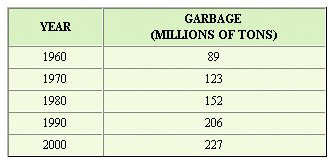
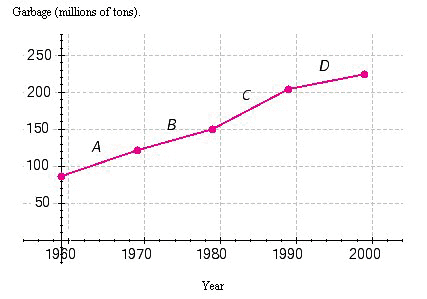
A) Slopes: A , 3.4; B , 2.9; C , 5.4; D , 2.1.
B) Slopes: A , 3.6; B , 3.0; C , 5.1; D , 2.0.
C) Slopes: A , 3.4; B , 3.0; C , 5.4; D , 2.0.
D) Slopes: A , 3.6; B , 3.0; C , 5.4; D , 2.1.
E) Slopes: A , 3.6; B , 2.9; C , 5.1; D , 2.1.
Correct Answer:

Verified
Correct Answer:
Verified
Q87: Graph the line that has an x
Q88: Find the equation of the line that
Q89: For the following equation, complete the given
Q90: Find the slope and y -intercept for
Q91: Complete the ordered pair for the equation.
Q93: Give the equation of the line with
Q94: Complete the ordered pair for the equation.
Q95: Find the x - and y -intercepts
Q96: Draw a straight line that passes through
Q97: Graph the ordered pair. <img src="https://d2lvgg3v3hfg70.cloudfront.net/TBX8671/.jpg" alt="Graph