Multiple Choice
The following table and line graph give the growth of a certain species over time. Find the slopes of the line segments labeled A , B , and C . DAY PLANT HEIGHT 0 0 1 0.3 2 1 3 1.4 4 4 5 5 6 7 7 11 8 15 9 20 10 26 
A) 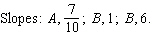
B) 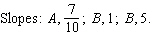
C) 
D) 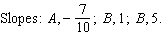
E) 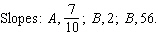
Correct Answer:

Verified
Correct Answer:
Verified
Q52: For the following problem, the slope and
Q53: Graph the solution set for the equation.
Q54: Find the equation of the line with
Q55: Find the slope and y -intercept for
Q56: Graph the linear inequality. <img src="https://d2lvgg3v3hfg70.cloudfront.net/TBX8671/.jpg" alt="Graph
Q58: Give the equation of the line with
Q59: Graph the solution set for the equation.
Q60: For the following equation, complete the given
Q61: For the following line the x -intercept
Q62: Graph the line that passes through the