Multiple Choice
Use a graphing utility to graph the damping factor and the function in the same viewing window. Describe the behavior of the function as x increases without bound. 
A) 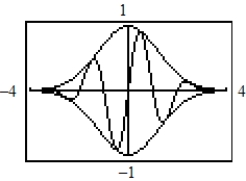
B) 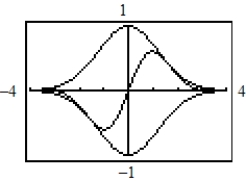

C) 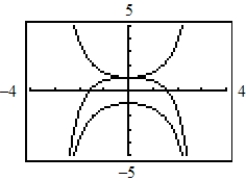

D) 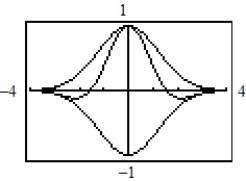

E) 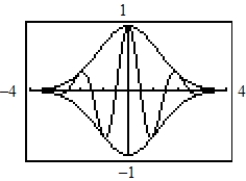

Correct Answer:

Verified
Correct Answer:
Verified
Q35: Sketch the graph of the function below,
Q36: Use the function value and constraint below
Q37: Evaluate the trigonometric function using its period
Q38: Find the indicated trigonometric value in the
Q39: Use a calculator to evaluate the function.
Q41: Use a calculator to evaluate the trigonometric
Q42: Describe the relationship between <img src="https://d2lvgg3v3hfg70.cloudfront.net/TBX8702/.jpg" alt="Describe
Q43: State the quadrant in which <img src="https://d2lvgg3v3hfg70.cloudfront.net/TBX8702/.jpg"
Q44: Use the graph shown below to determine
Q45: Determine two coterminal angles (one positive and