Multiple Choice
The table lists the approximate value V of a mid-sized sedan for the years 2003 through 2009. The variable t represents the time in years, with  corresponding to 2003. Use the regression capabilities of a graphing utility to fit an exponential model to the data. Round all numerical values in your answer to four decimal places. Your answer may be slightly different depending on the number of digits your graphing utility uses in computations.
A) 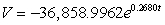
B) 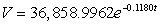
C) 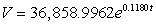
D) 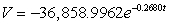
E) 
Correct Answer:

Verified
Correct Answer:
Verified
Q1: Solve the differential equation <img src="https://d2lvgg3v3hfg70.cloudfront.net/TBX8702/.jpg" alt="Solve
Q2: Find <img src="https://d2lvgg3v3hfg70.cloudfront.net/TBX8702/.jpg" alt="Find if
Q4: The rate of change of N is
Q5: Evaluate the definite integral <img src="https://d2lvgg3v3hfg70.cloudfront.net/TBX8702/.jpg" alt="Evaluate
Q6: Suppose a population of bacteria is changing
Q7: Suppose the term of a mortgage t
Q8: Suppose that the population (in millions) of
Q9: Find the derivative of the function <img
Q10: Find the indefinite integral of <img src="https://d2lvgg3v3hfg70.cloudfront.net/TBX8702/.jpg"
Q11: Find the indefinite integral. <img src="https://d2lvgg3v3hfg70.cloudfront.net/TBX8702/.jpg" alt="Find