Multiple Choice
Use a graphing utility to graph the function and visually determine the intervals over which the function is increasing, decreasing, or constant. 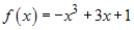
A) 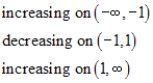
B) 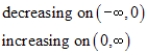
C) 
D) 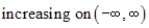
E) 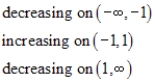
Correct Answer:

Verified
Correct Answer:
Verified
Q23: Determine whether the variation model below is
Q24: Does the table describe a function? <img
Q25: Find the inverse function of <img src="https://d2lvgg3v3hfg70.cloudfront.net/TBX8702/.jpg"
Q26: Use a graphing utility to graph the
Q27: Find the inverse function of f. <img
Q29: The simple interest on an investment is
Q30: Find all real values of x such
Q31: Find <img src="https://d2lvgg3v3hfg70.cloudfront.net/TBX8702/.jpg" alt="Find f
Q32: Find <img src="https://d2lvgg3v3hfg70.cloudfront.net/TBX8702/.jpg" alt="Find f
Q33: Which equation does not represent y as