True/False
The graph of a linear inequality is shown. Tell whether point  satisfies the inequality.
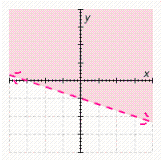
Correct Answer:

Verified
Correct Answer:
Verified
Related Questions
Q20: The ordered pair (1, 3) is a
Q21: Solve the system by graphing: <img src="https://d2lvgg3v3hfg70.cloudfront.net/TBX8672/.jpg"
Q22: Solve the system by graphing: <img src="https://d2lvgg3v3hfg70.cloudfront.net/TBX8672/.jpg"
Q23: On average, it takes an accountant 1
Q24: Find the solution set of the system
Q25: Decide whether the ordered pair <img src="https://d2lvgg3v3hfg70.cloudfront.net/TBX8672/.jpg"
Q26: Use two equations in two variables to
Q28: Dry Boat Works wholesales aluminum boats for
Q29: Decide whether each ordered pair is a
Q30: Solve the system by graphing: <img src="https://d2lvgg3v3hfg70.cloudfront.net/TBX8672/.jpg"