Multiple Choice
The temperature (in ° F) of a town is taken at the beginning of each hour throughout one day starting at 5 a.m. Let T be the function defined by T(x) = temperature of the town at time x . Which one of the following graphs represents this scenario?
A) 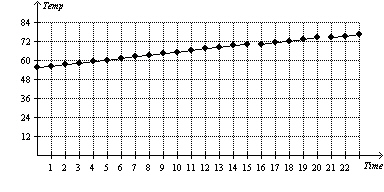
B) Not enough information
C) 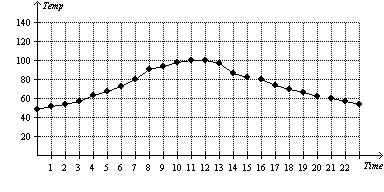
D) 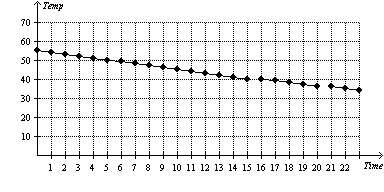
E) 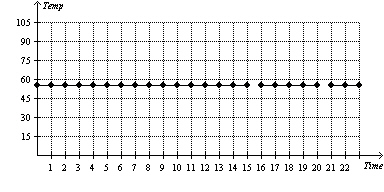
Correct Answer:

Verified
Correct Answer:
Verified
Q262: Simplify <img src="https://d2lvgg3v3hfg70.cloudfront.net/TBX8673/.jpg" alt="Simplify ."
Q263: Evaluate the expression <img src="https://d2lvgg3v3hfg70.cloudfront.net/TBX8673/.jpg" alt="Evaluate the
Q264: Use the data given to create a
Q265: Which one of the following graphs represent
Q266: Find the value of the absolute value
Q268: Your job pays $9.50 per hour. Complete
Q269: Round <img src="https://d2lvgg3v3hfg70.cloudfront.net/TBX8673/.jpg" alt="Round to
Q270: Use the table to make a scatterplot.
Q271: The verbal description below can be represented
Q272: Subtract the fractions. Reduce to simplest form.