Multiple Choice
A population of rabbits was tracked over a 55-day period. The data is shown in the following graph. How did the population of rabbits change between day 3 and day 20? 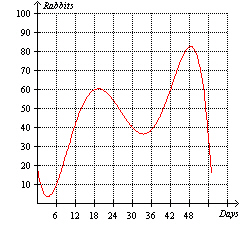
A) The population of rabbits increased from approximately 5 rabbits to 83 rabbits.
B) The population of rabbits decreased from approximately 83 rabbits to 5 rabbits.
C) The population of rabbits increased from approximately 5 rabbits to 61 rabbits.
D) The population of rabbits was constant during this time period.
E) The population of rabbits decreased from approximately 61 rabbits to 5 rabbits.
Correct Answer:

Verified
Correct Answer:
Verified
Q114: Plot the points in the coordinate plane.
Q115: A submarine was cruising 250 m below
Q116: Subtract the fractions. Reduce to simplest form.
Q117: The mass of bacteria (in micrograms) in
Q118: The resistance R of a wire (in
Q120: <img src="https://d2lvgg3v3hfg70.cloudfront.net/TBX8673/.jpg" alt=" and
Q121: Use the bar chart to answer the
Q122: The table below illustrates a set of
Q123: The table below gives the cost for
Q124: Write <img src="https://d2lvgg3v3hfg70.cloudfront.net/TBX8673/.jpg" alt="Write as