Multiple Choice
A population of rabbits was tracked over a 55-day period. The data is shown in the following graph. What was the minimum number of rabbits during this time? 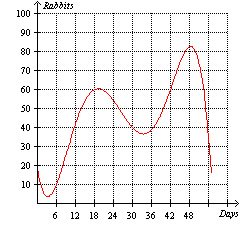
A) 20
B) 37
C) 83
D) 5
E) 15
Correct Answer:

Verified
Correct Answer:
Verified
Q295: The relation <img src="https://d2lvgg3v3hfg70.cloudfront.net/TBX8673/.jpg" alt="The relation
Q296: State whether the multiplication property or the
Q297: Translate the phrase into an algebraic expression.<br>Three
Q298: Multiply the fractions. Reduce to simplest form.
Q299: Find the distance between 9 and <img
Q301: The number of gallons of water remaining
Q302: Translate the phrase into an algebraic expression.<br>The
Q303: Use the order of operations agreement to
Q304: Use the following graph to create an
Q305: What is the number of terms in