Multiple Choice
A population of rabbits was tracked over a 55-day period. The data is shown in the following graph. What was the approximate number of rabbits on day 30? 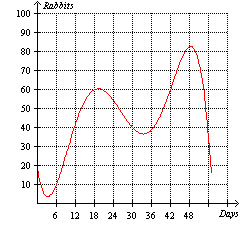
A) 40
B) 15
C) 10
D) 30
E) 83
Correct Answer:

Verified
Correct Answer:
Verified
Q337: Find the value of <img src="https://d2lvgg3v3hfg70.cloudfront.net/TBX8673/.jpg" alt="Find
Q338: Round 7.098 to the hundredths place.
Q339: Write the coordinates of the ordered pair
Q340: Round <img src="https://d2lvgg3v3hfg70.cloudfront.net/TBX8673/.jpg" alt="Round to
Q341: Simplify the expression using the order of
Q343: A variable y is a function of
Q344: Is the equation <img src="https://d2lvgg3v3hfg70.cloudfront.net/TBX8673/.jpg" alt="Is the
Q345: The price per gallon of gas at
Q346: Translate the phrase into an algebraic expression.<br>35
Q347: Multiply or divide as indicated without a